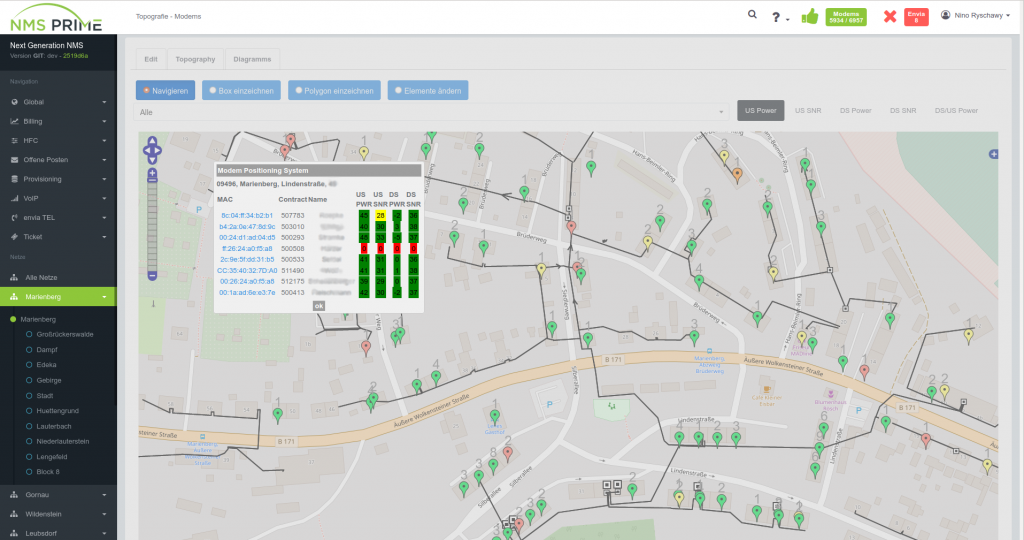
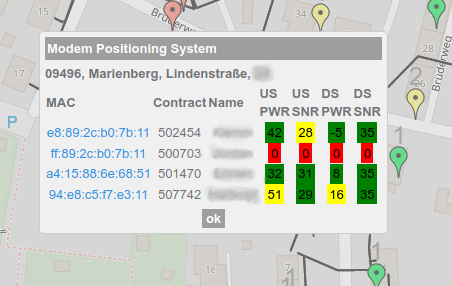
In version 2.5.4 a new improvement in the topography makes it more convenient to find a potential distortion in your network.

As you can see in the picture now the averaged real time signal parameters of all modems inside a realty (entrance) are shown well-aranged in one table. You just have to view the customers on the map and open the table via a left-klick on the modem/realty entrance.
If you want to check it out by yourself, just head to our demo system.
